| CSC373/406: 9 [9/13] | |
Figure 9.1: Time scale of computer system events.
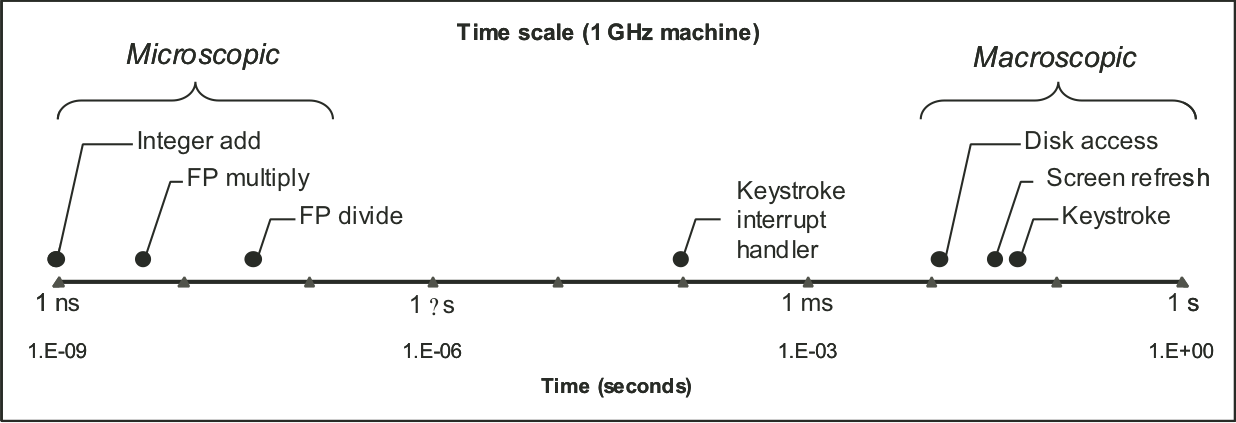
Figure 9.2: System's vs.~applications view of time.
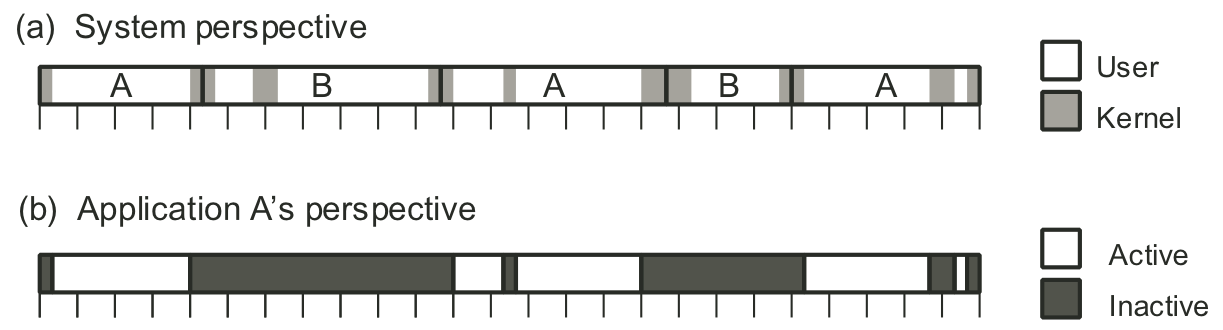
Figure 9.4: Graphical representation of trace in Figure ....
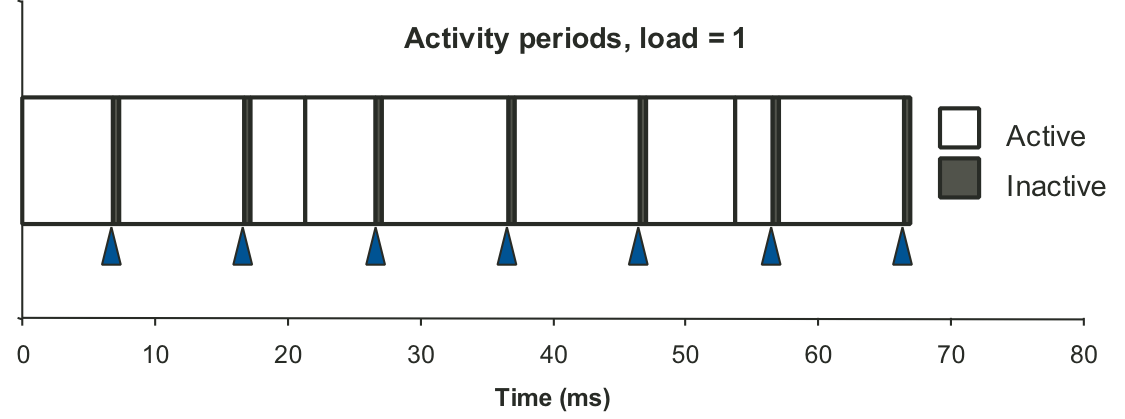
Figure 9.6: Graphical representation of activity periods for trace in Figure ....
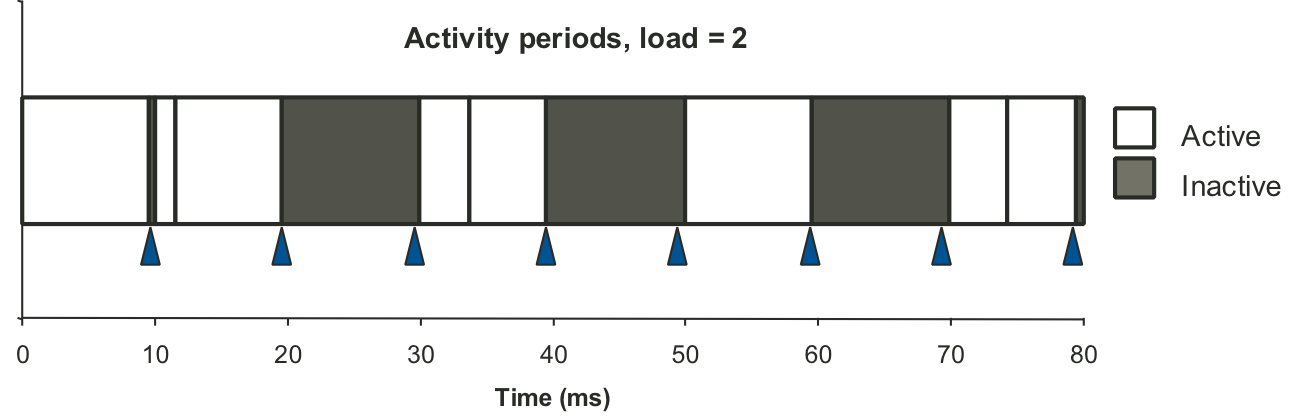
Figure 9.7: Process timing by interval counting.
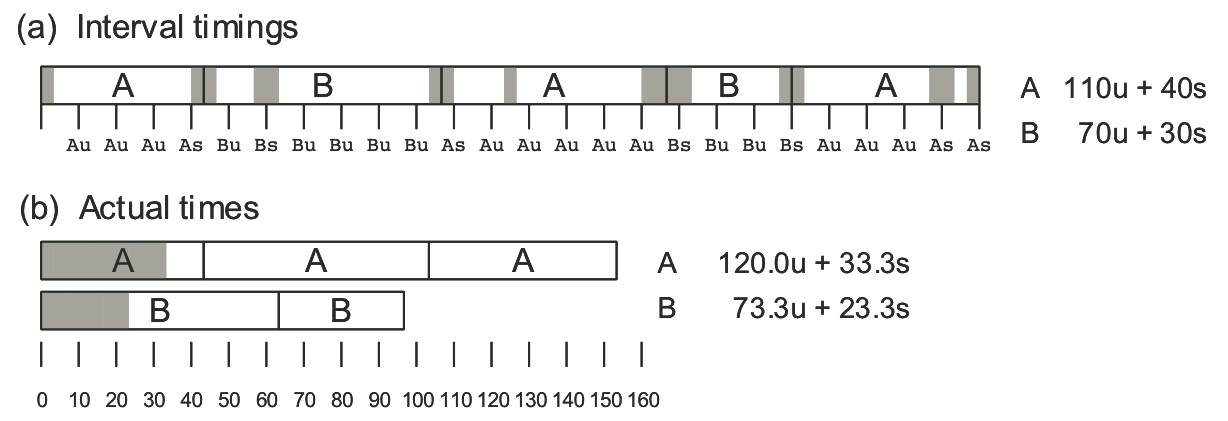
Figure 9.8: Measuring interval counting accuracy.
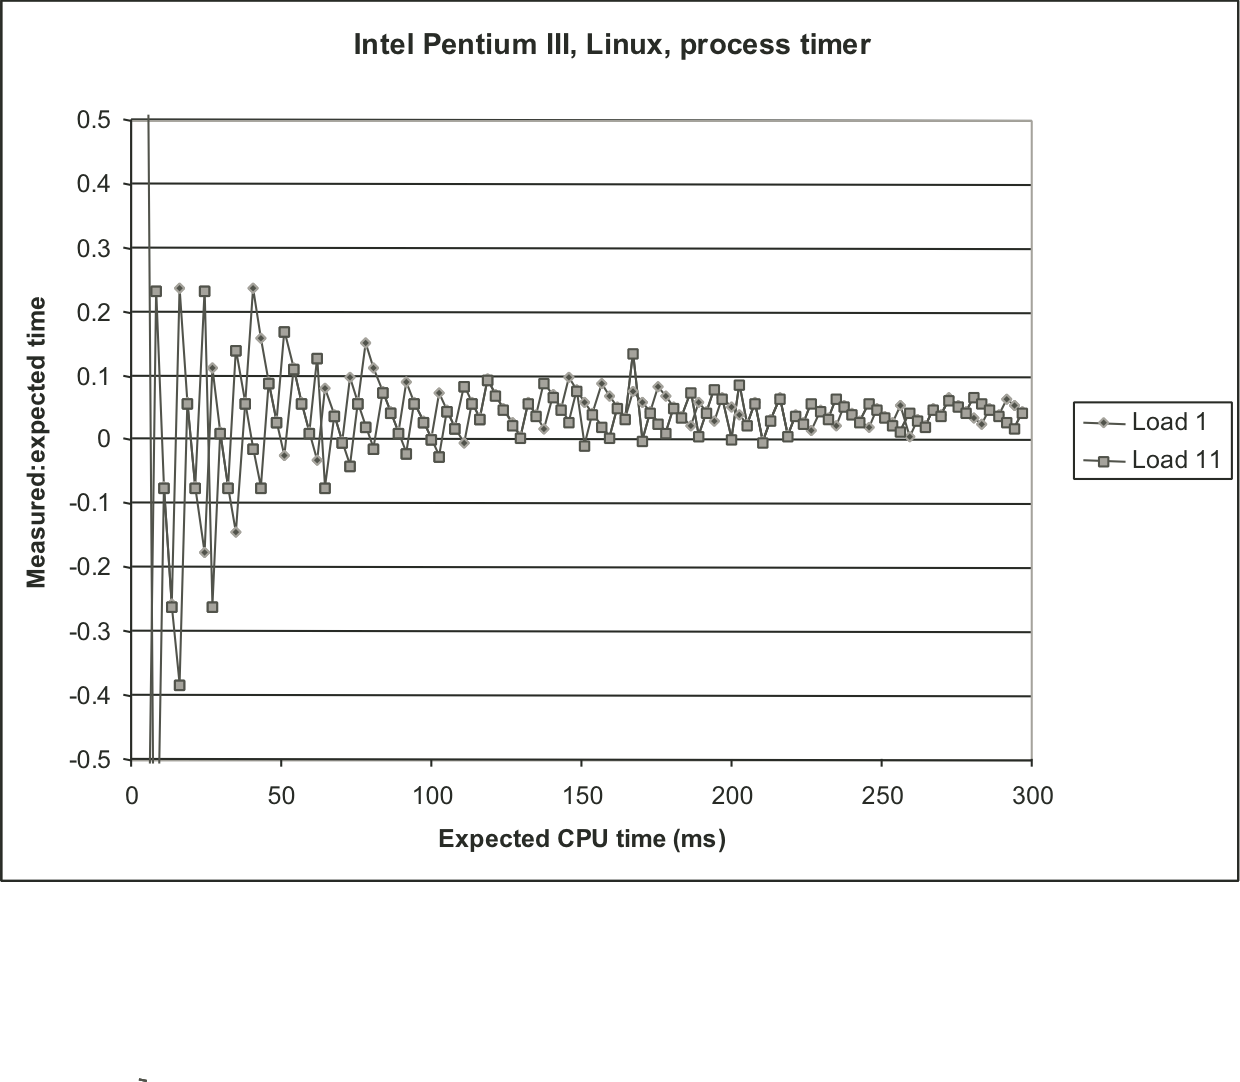
Figure 9.11: Measurements of long duration procedure under different loading conditions.
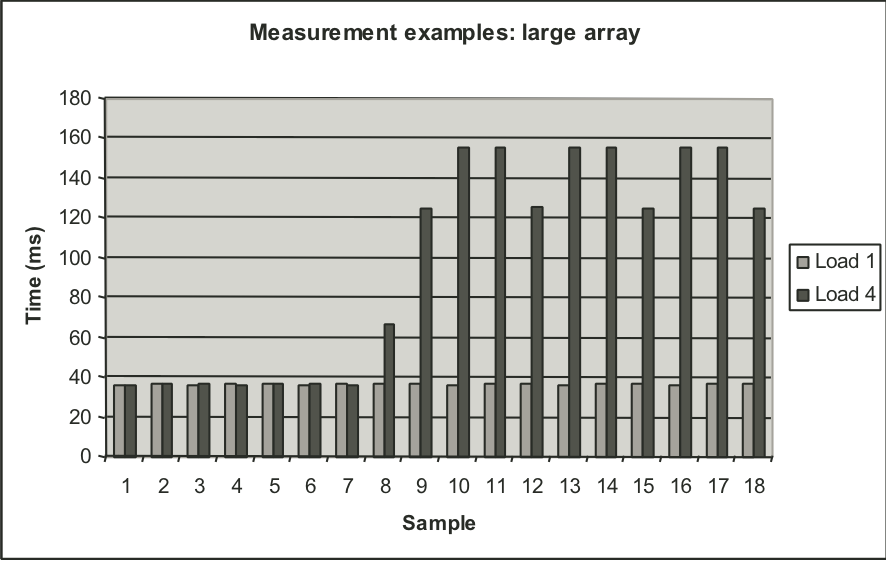
Figure 9.12: measurements of short duration procedure under different loading conditions.
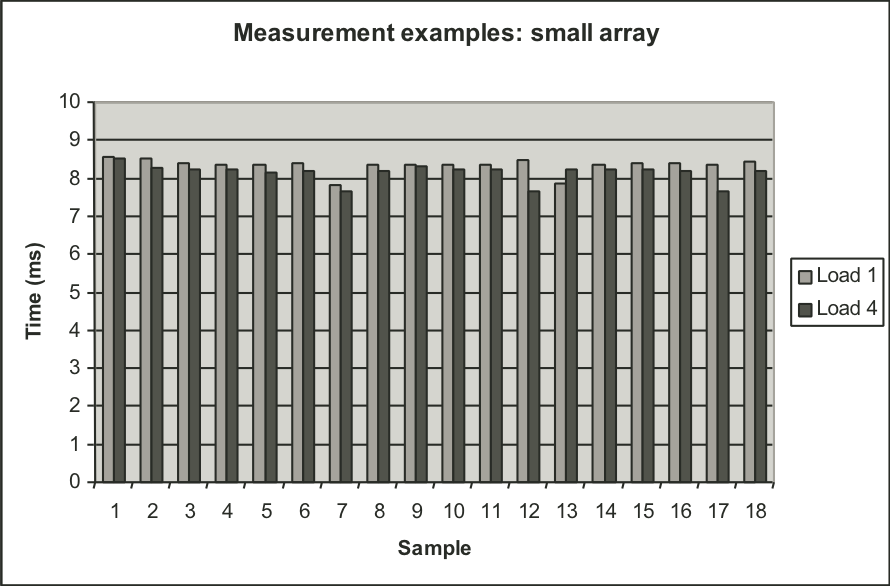
Figure 9.14: Experimental validation of K-best measurement scheme on Linux system
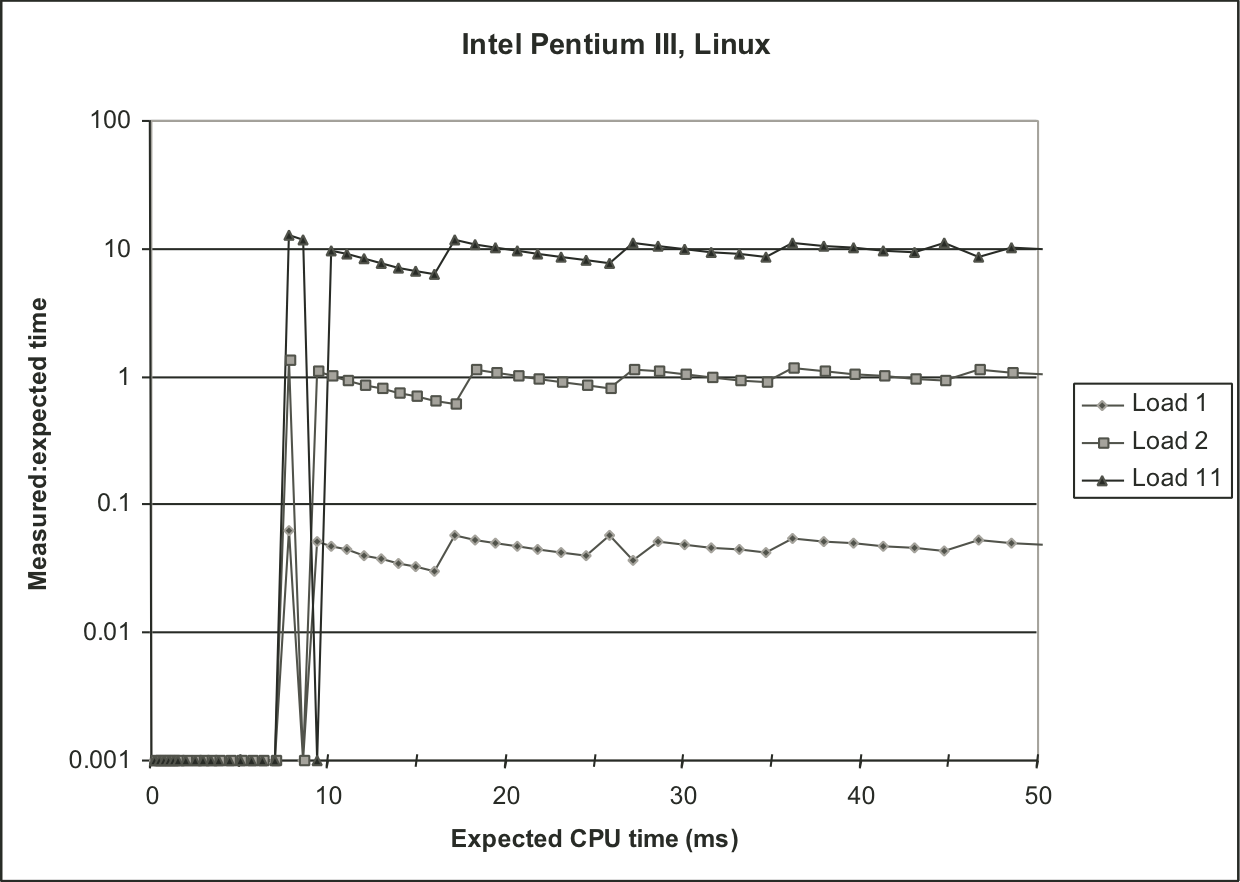
Figure 9.15: Effectiveness of K-best scheme for different values of K.
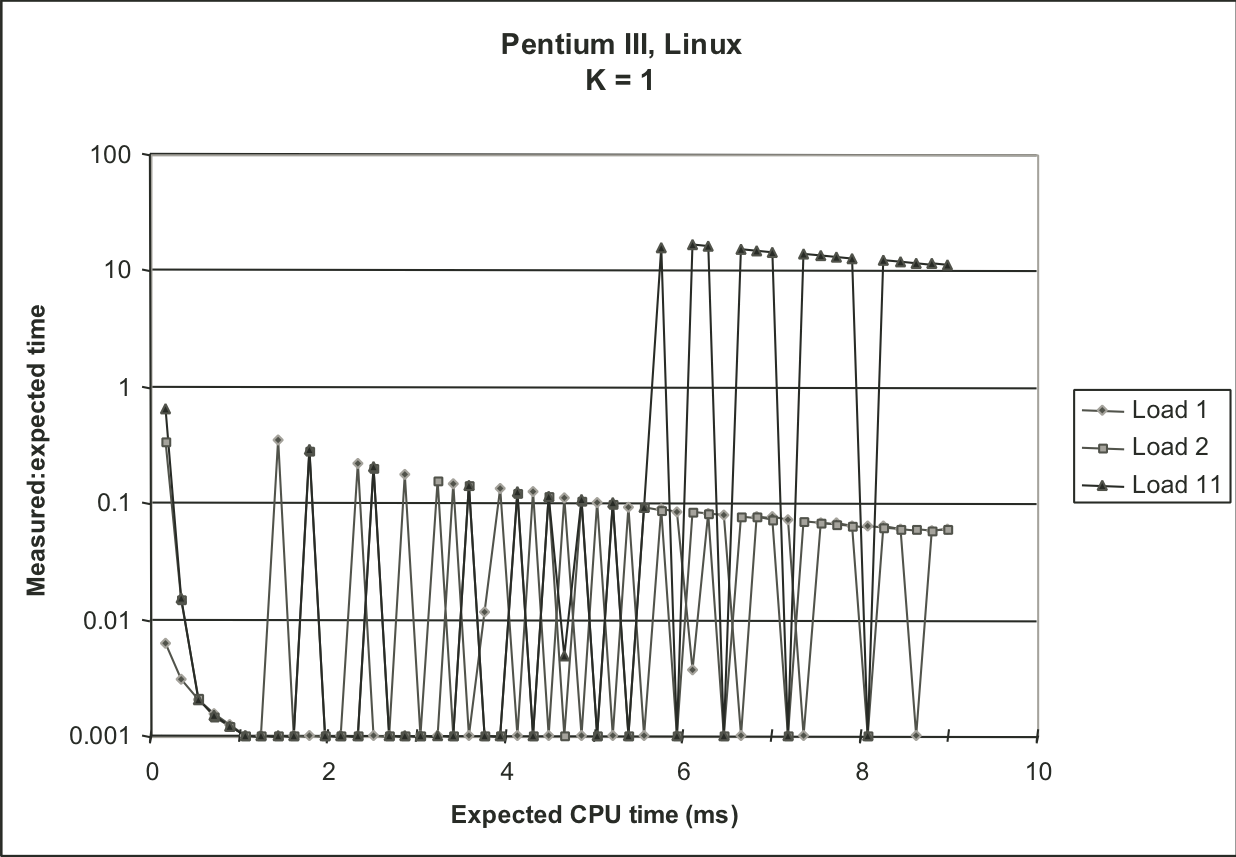
Figure 9.15: Effectiveness of K-best scheme for different values of K.
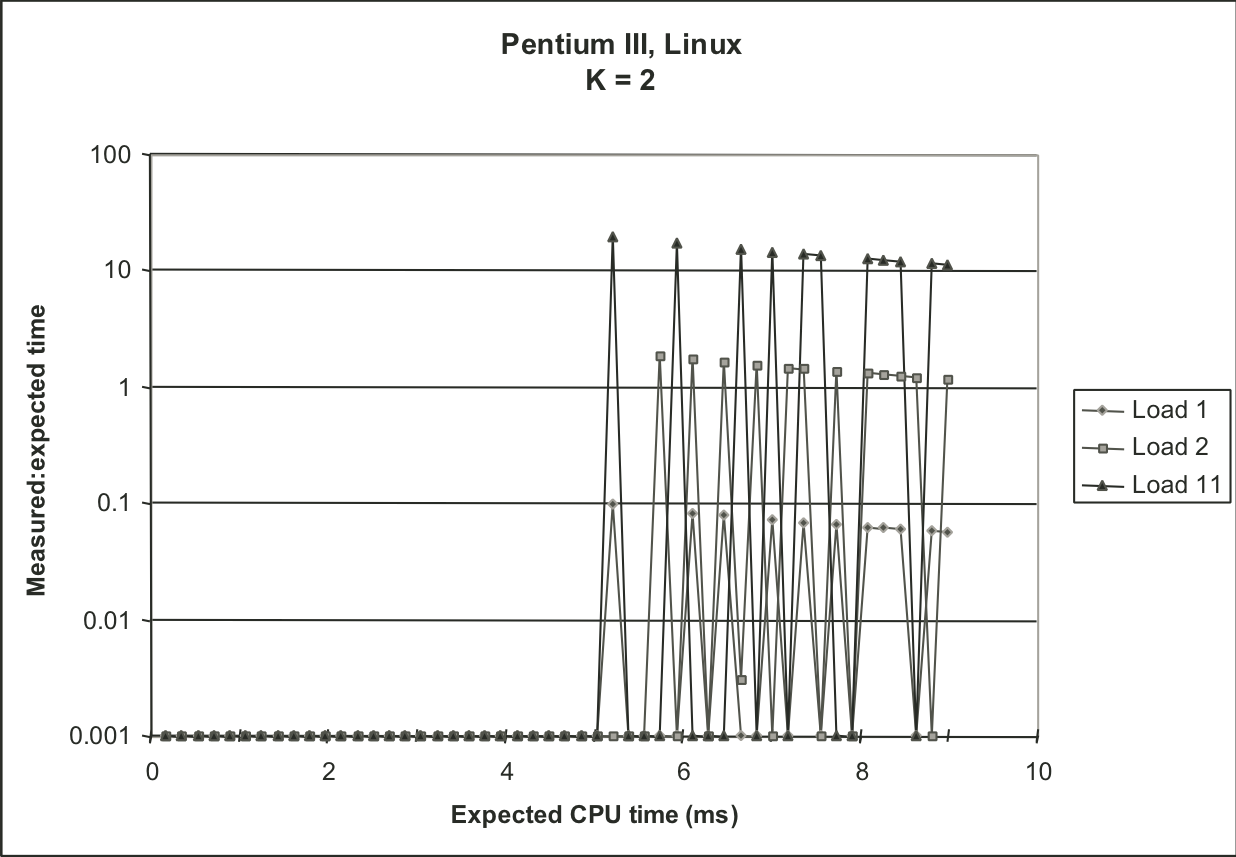
Figure 9.15: Effectiveness of K-best scheme for different values of K.
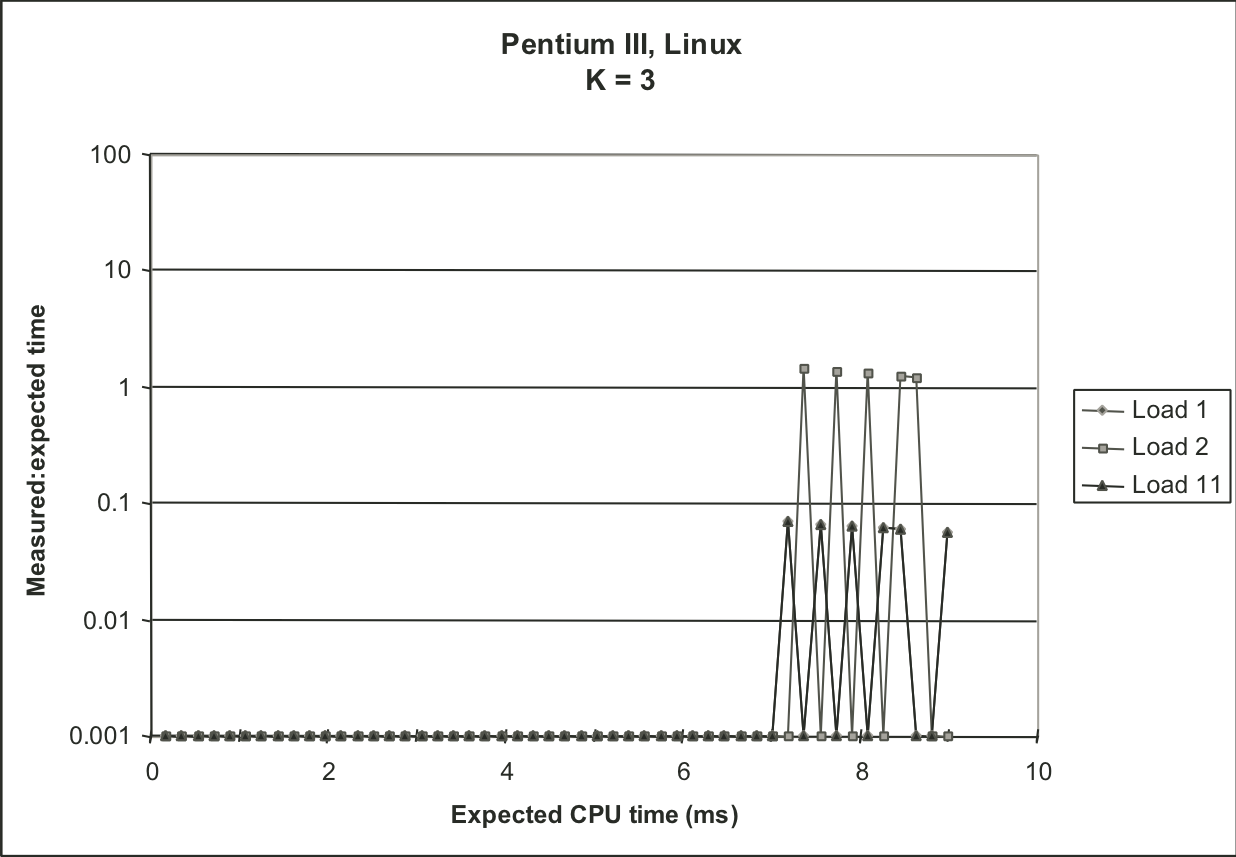
Figure 9.15: Effectiveness of K-best scheme for different values of K.
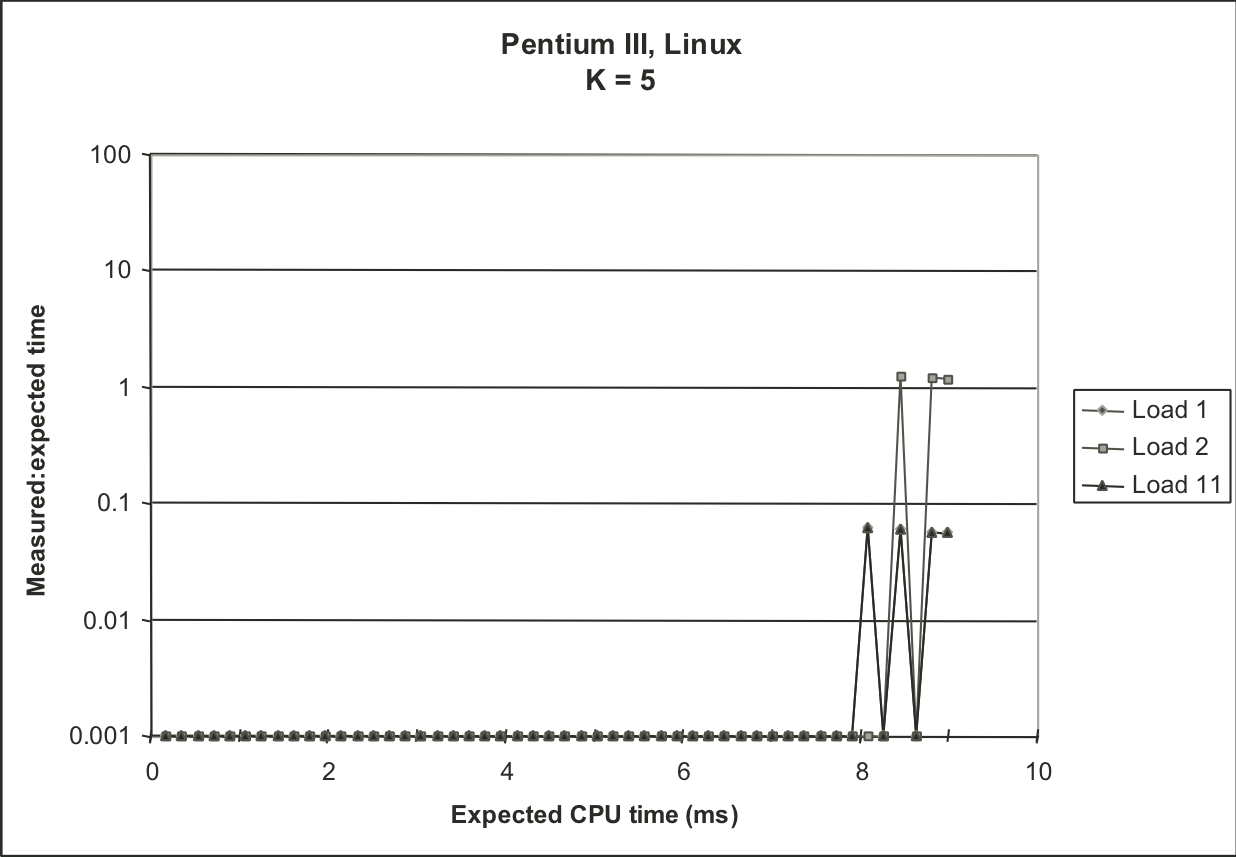
Figure 9.16: Measurements with compensation for timer interrupt overhead.
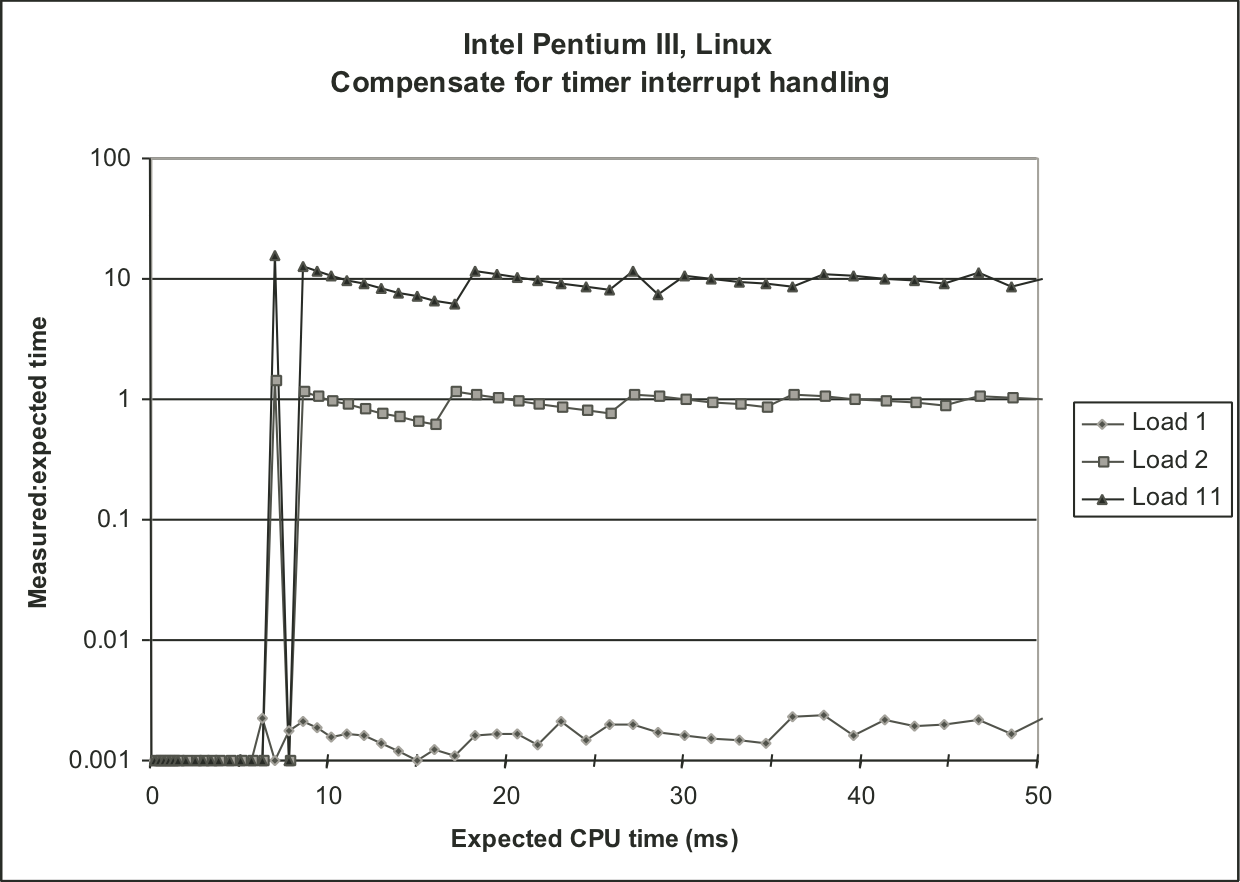
Figure 9.17: Experimental validation of K-best measurement scheme on IA32/Linux system with older version of the kernel.
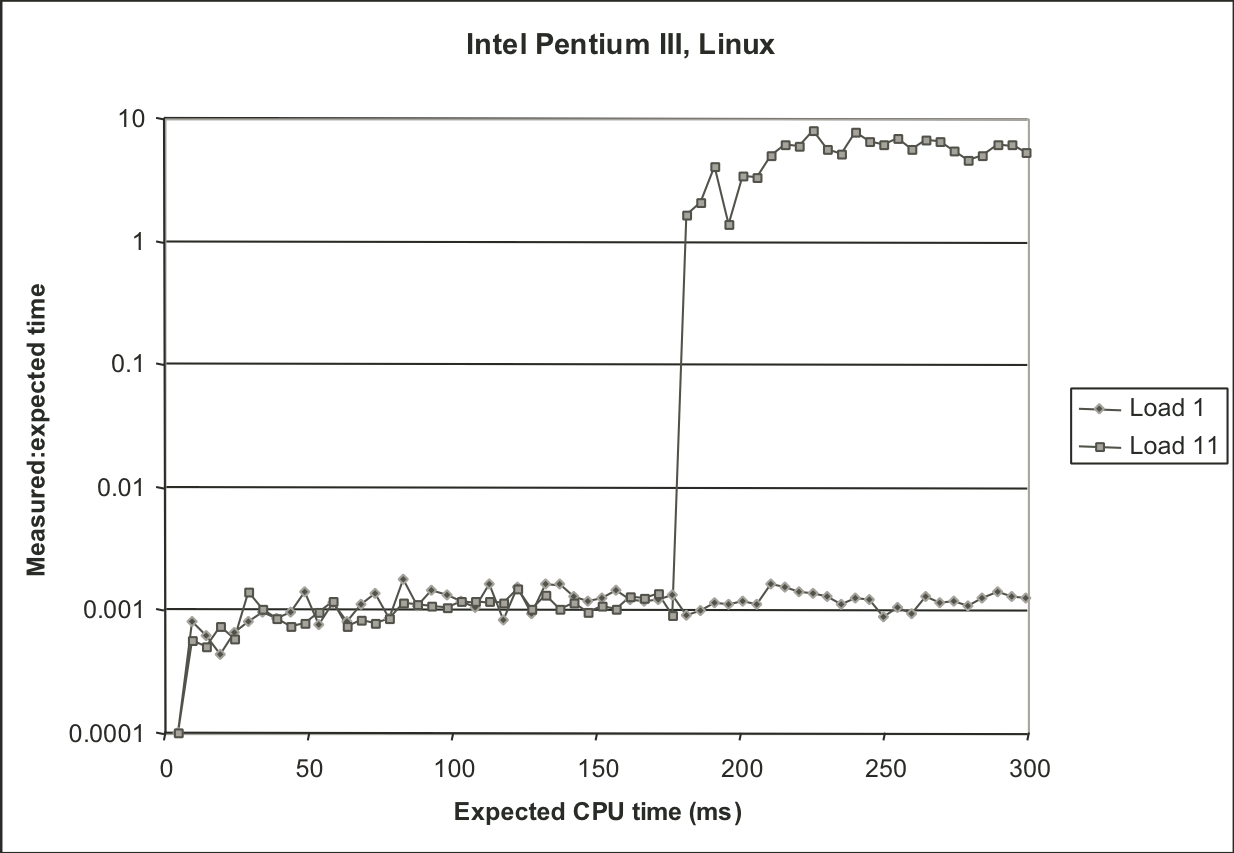
Figure 9.18: Experimental validation of K-best measurement scheme on Windows-NT system.
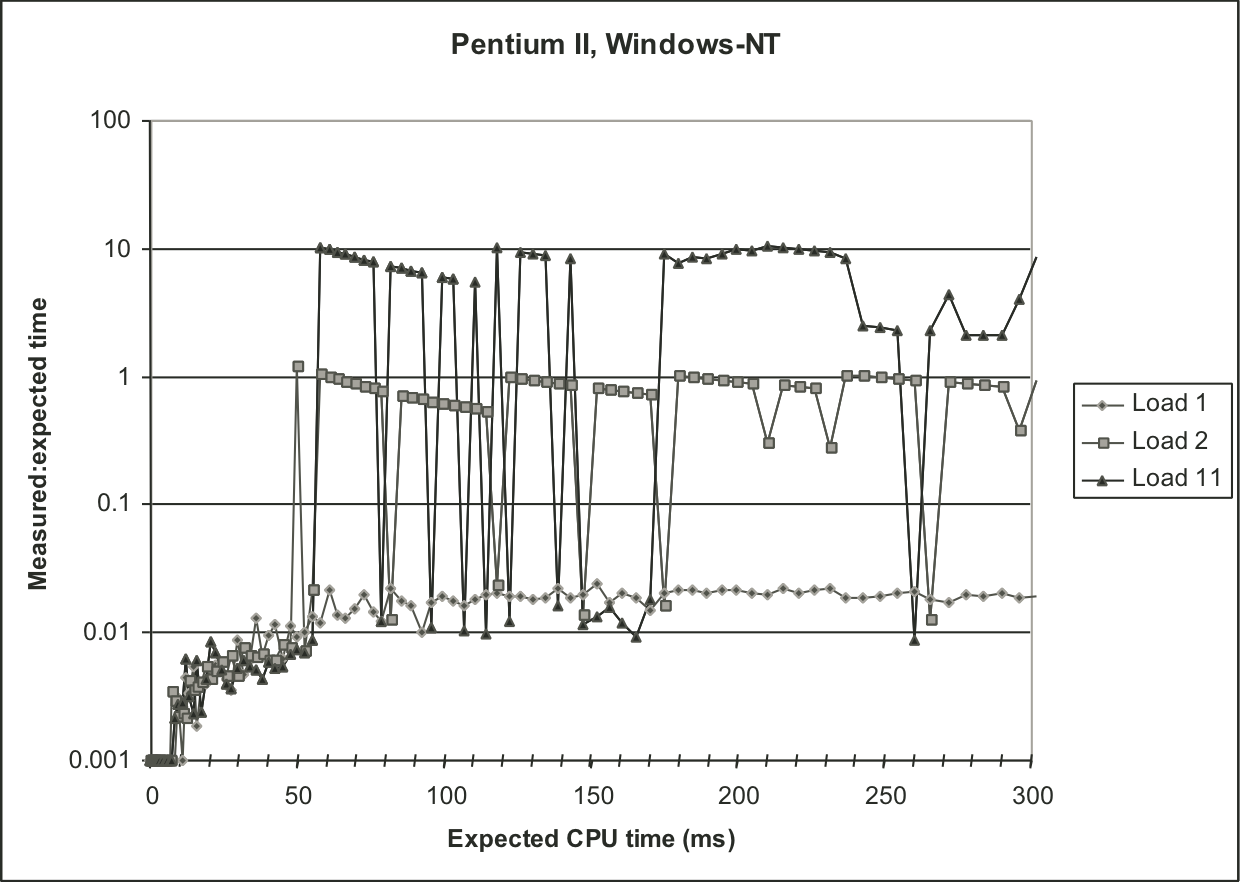
Figure 9.19: Experimental validation of K-best measurement scheme on Compaq Alpha system.
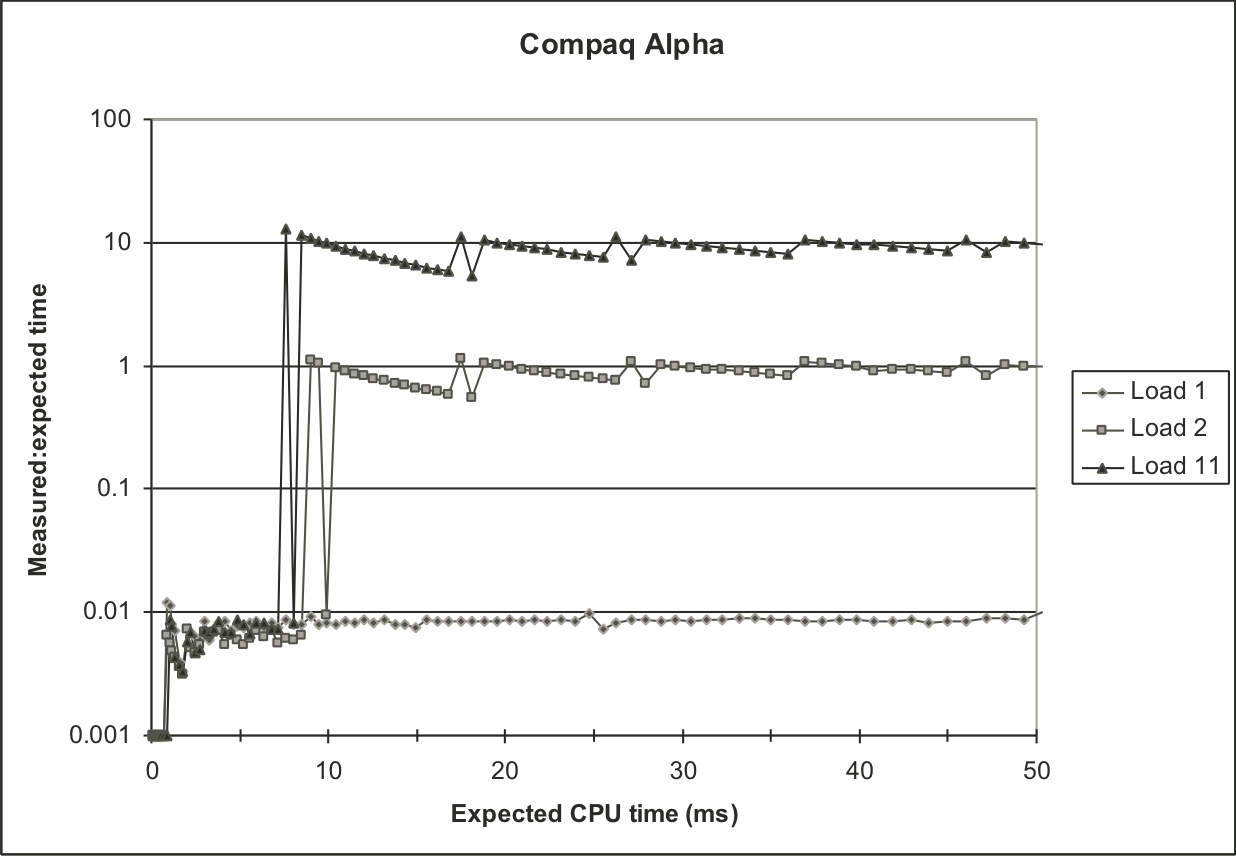
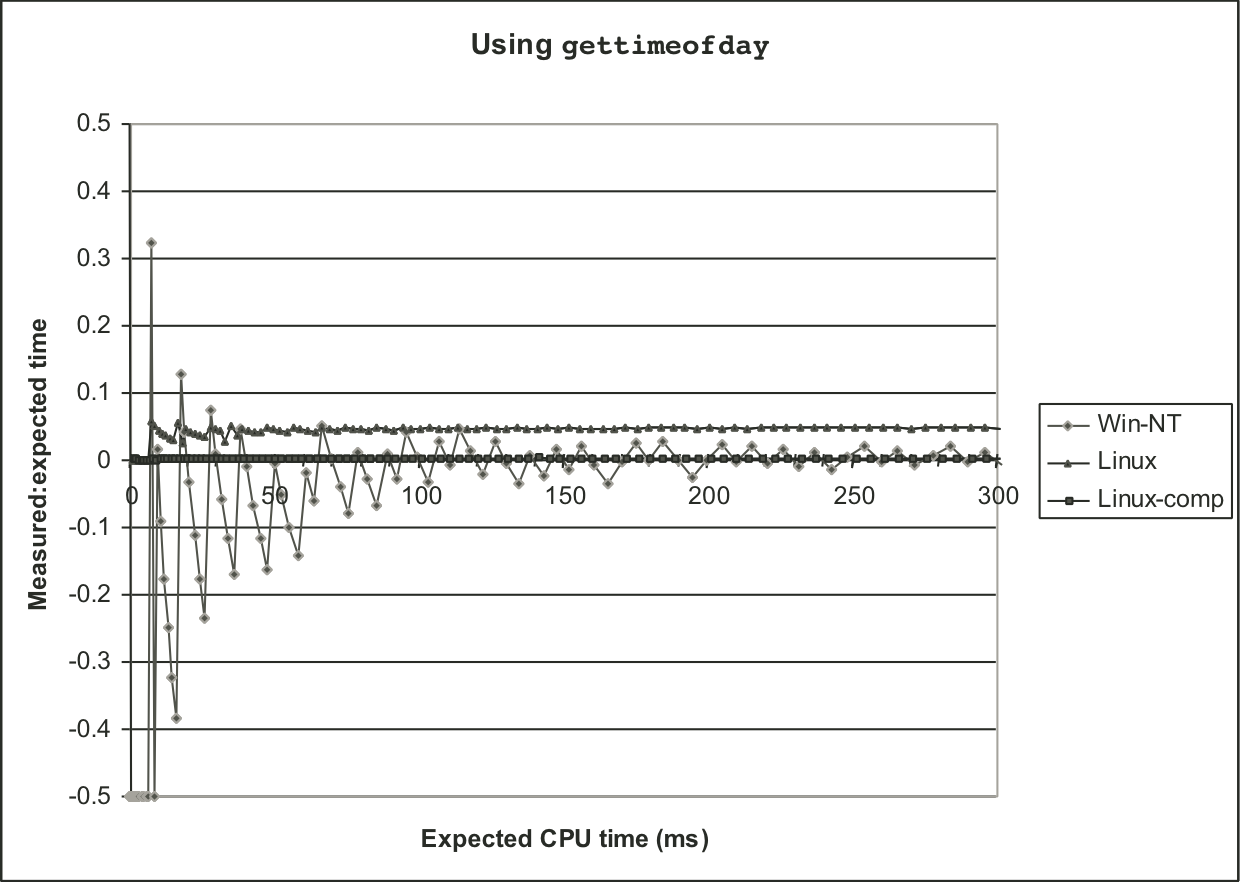
Figure 9.22: Experimental validation of K-best measurement scheme using gettimeofday function.